
Retirement is often seen through the lens of developed markets, where relatively more robust Social Security, healthcare, and defined contribution systems exist. Asia, however, offers compelling lessons (for within Asia) in what the future of retirement looks like as the region’s markets currently offer differing levels of retirement protection, and with varying demographic profiles, they’re looking at policy innovations to prepare for the future. The main objective of the Diverse Asia series is to show how the selected markets of Hong Kong, Indonesia, Malaysia, and Taiwan are forging their own path to meet the challenges and to offer new opportunities for their populations. We hope to show how the diversity of Asia, as well as the diversity of populations served, provides a potential template for others to learn and study.
In the first of a series of articles, Manulife Investment Management explores the retirement readiness of different populations in the Asia-Pacific region while considering the issues and responses from Hong Kong, Indonesia, Malaysia, and Taiwan. The content has been developed with insight and research from the Sau Po Centre on Ageing at the University of Hong Kong1.
Our intention is to take a deep dive into Asia’s retirement readiness in a contextualised way and explore the subject through both a quantitative and qualitative lens.

For the purposes of this series, we focused our research on Hong Kong, Indonesia, Malaysia, and Taiwan, as these represent a truly diverse Asia due to differences in demographic stages. They all have young, ageing, and aged populations, and their respective governments and industries have started introducing their own solutions to their respective demographic and healthcare challenges.
With Asia home to a diverse set of countries with young, ageing, and aged populations, our findings demonstrate that there truly is no one-size-fits-all approach for Asian retirees to consider. We analyse socioeconomic factors such as ageing, gender, and family structures as key to the retirement conversation. What works for Hong Kong’s population may not work as well for the people in Malaysia. But diversity is a strength, and when it comes to solving the retirement readiness puzzle, countries within Asia have much to learn from each other.
We believe the best way to cater to the retirement needs of various diverse groups is to offer various perspectives, trigger new thoughts, and empower individuals with the literacy and digital tools to make informed decisions and become financially better off in the long term. This series has been created because we want to encourage more open and direct discussions around these issues, because none of us can afford for these factors to be ignored.
At Manulife Investment Management, our presence within these markets gives us a unique investment footprint. It allows us to serve different populations and presents us with the opportunity to tell their story and to show a side of Asia that those without local presence can’t see. We’re therefore pleased to present our findings and to tell the unique story of each of these markets. We believe that the insight we’ve gathered can also be used to benefit the rest of Asia.
The world’s ageing population is a well-known concern. Demographic shifts are being guided by a declining birth rate, shrinking households, rising healthcare costs, and fragmentation among traditional family structures.

According to the World Health Organization (WHO), by 2030, one in every six people in the world will be aged 60 years or over. But beneath that underlying fact, different populations are ageing at different rates, and nowhere is this variation more visible than within Asia. According to the Asian Development Bank, by 2030, one out of four people in Asia will be over 60; however, some Southeast Asia countries such as Laos and Cambodia have some of the youngest populations in the world, with populations aged 65+ at merely 5.5% and 4.4%, respectively. This only underlines the point that Asia is a hugely diverse region, characterised by different markets at varying stages of economic and demographic development.
Take Hong Kong as an example: Hong Kong is an aged population, with 19.1% of its population over 65; moreover, 24.5% of Hong Kong adults are aged between 50 and 64. This makes the median age of the total Hong Kong population 44.9 years old, the second highest in Asia. Markets such as Japan are now considered super-aged, with 28.7% of the population above 65 years old. At the other end of the spectrum is Indonesia, considered to be much younger, with just 6.3% of its population aged 65+. But Indonesia has its own demographic challenges and has suffered a dramatic decline in its old-age support ratio—the number of people aged 15 to 64 per one older person aged 65+, which is estimated to drop from 13.8 in 2000 to 4.1 in 2050—ever since the Indonesia government took steps to control overpopulation in the 1970s.
In short, just as with many countries in the West, broadly speaking, Asia must address the dual challenge of more elderly people in retirement and fewer younger people able to care for them. But despite this challenging backdrop, there are positive developments across different countries to highlight.
These come both in the form of government policy initiatives and from individuals who are willing to take their retirement planning firmly into their own hands and consider all the available investment options. Solutions are there in the form of varying degrees of state support, open-market options for pensions and retirement-focused investments, and family structures. The degree of diversity within the concept of ageing presents fertile ground for exploring and testing solutions, given Asia is less locked into legacy pension systems compared with developed regions. Moreover, a broad range of demographic, economic, and social contexts is injecting several dynamics into Asia’s retirement landscape. As a result, Asia’s retirement landscape remains both hopeful and notably more positive when compared with Europe and the United States.
To consider the complexities of Asia’s demographic challenges, as well as the responses to those challenges, it’s important to start with some clear definitions of what ageing means on a region-by-region basis. Our definitions are as follows, with references to the United Nations and Organisation for Economic Co-operation and Development (OECD) :
• Young—Regions in which less than 7% of the population is aged 65+
• Ageing—Regions in which more than 7% to less than 14% of the population is aged 65+
• Aged—Regions in which more than 14% to less than 20% of the population is aged 65+
• Super-aged—Regions in which more than 20% of the population is aged 65+
According to these definitions, only a handful of Asia populations is in the young category, including Indonesia, the Philippines, and Cambodia; Mainland China and Malaysia are in the ageing category; and Hong Kong, South Korea and Taiwan alike are in the aged category.
 Source: “World Population Prospects 2022, Online Edition,” United Nations Department of Economic and Social Affairs, Population Division, 2022.
 Source: “World Population Prospects 2022, Online Edition,” United Nations Department of Economic and Social Affairs, Population Division, 2022.
It’s important to note that besides measuring just age, we’re also adopting a portfolio concept — aggregating a range of demographic statistics holistically — in defining whether a society is aged. To understand the impact of ageing on social and economic development in a specific demographic context, a portfolio concept can provide us with a different lens that could yield organic views.


Source: “World Population Prospects 2022, Online Edition,” United Nations Department of Economic and Social Affairs, Population Division, 2022. Life expectancy and old-age dependency ratio/support ratio data is from “World Population Prospects 2022, Online Edition,” United Nations Department of Economic and Social Affairs, Population Division, 2022; health-adjusted life expectancy data for regions other than Hong Kong and Taiwan is from “Healthy life expectancy (HALE) Data by Market,” World Health Organization, 2020; healthy life expectancy data for Hong Kong is adapted from “Are We Living Longer and Healthier?” Journal of Aging and Health, 2020; and data for Taiwan is adapted from “Mortality, morbidity, and risk factors in Taiwan, 1990–2017: Findings from the Global Burden of Disease Study 2017,” Journal of the Formosan Medical Association, 2021.
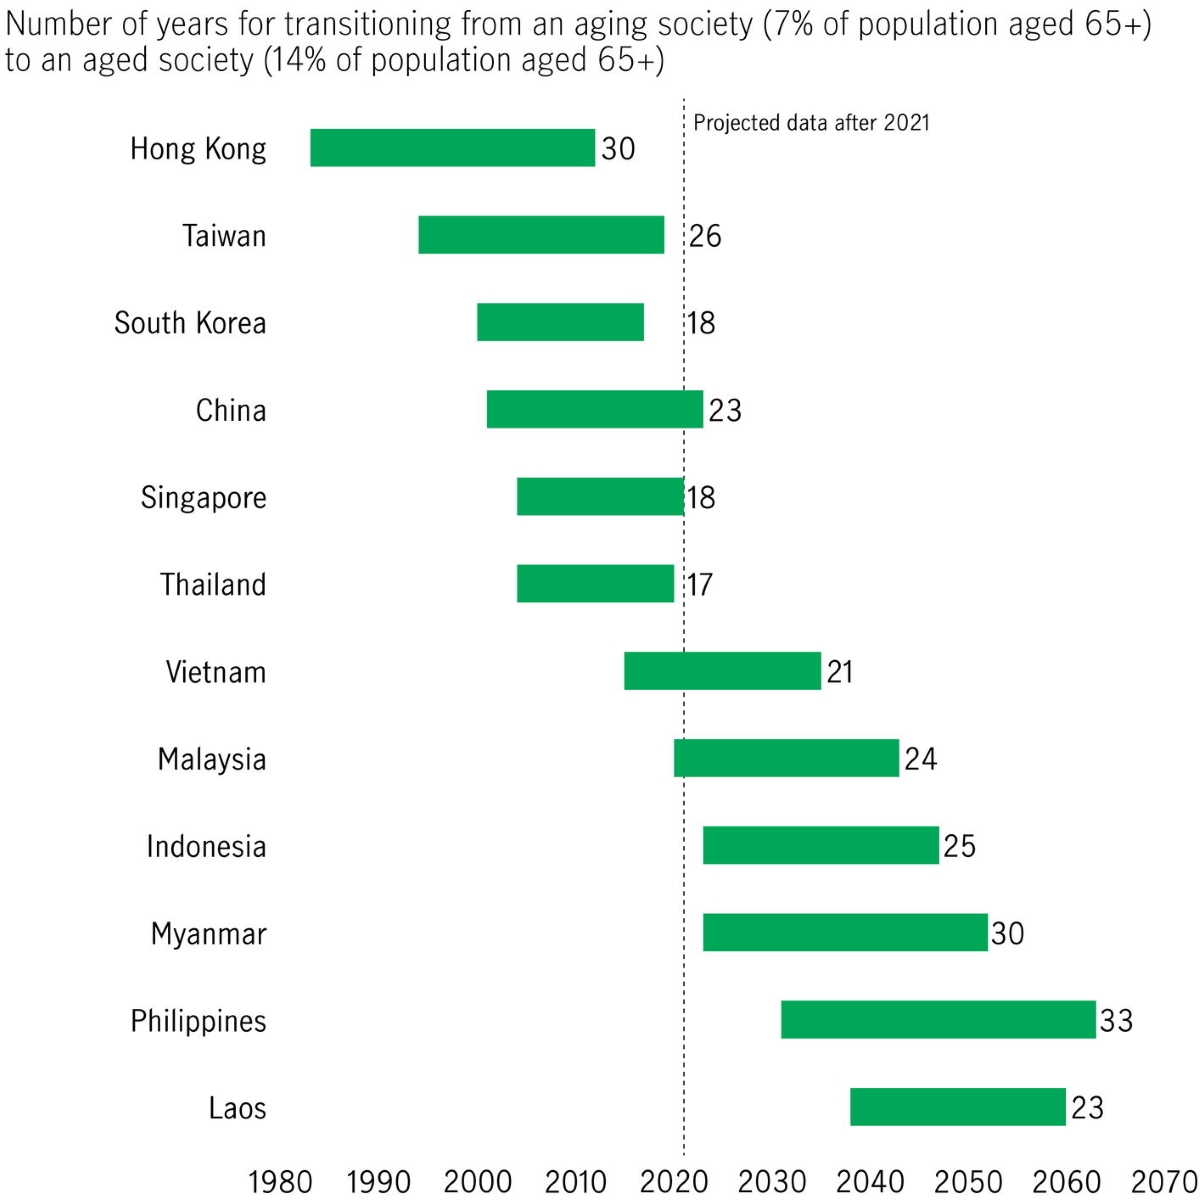
Moreover, for many Asian markets, the speed of the transition from an ageing to an aged society is increasing. According to the Asia Health and Wellbeing Initiative, East and Southeast Asia alone are expected to have 572.5 million seniors aged 65+ by 2050, which is more than double today’s number. We believe the unique challenge for Asia is the pace of this transition, which is occurring at a rate 3x to 4x faster than any other market.
We can also consider the future trajectory of population ageing in each Asia market, which can be indicated by the number of years it takes for the population to switch from ageing to aged. Based on current information, we therefore estimate Asia will become aged in less than 20 years (by 2040) and super-aged in less than 40 years’ time (by 2060).
In our view, a sustainable world in the context of ageing would therefore depend on a sustainable Asia. By 2050, the elderly population in Asia will account for 63% of the world’s aged population and will have its own ageing features as already discussed (diversified ageing speed, heterogeneous demographic stages); therefore, Asia must develop its own retirement strategies from both a public (government) and private (industry) market point of view. In other words, there is no model to follow: Asia must develop its own.
 Source: “World Population Prospects 2022, Online Edition,” United Nations Department of Economic and Social Affairs, Population Division, 2022.
 Source: “World Population Prospects 2022, Online Edition,” United Nations Department of Economic and Social Affairs, Population Division, 2022.
 Source: “World Population Prospects 2022, Online Edition,” United Nations Department of Economic and Social Affairs, Population Division, 2022.
 Source: “World Population Prospects 2022, Online Edition,” United Nations Department of Economic and Social Affairs, Population Division, 2022.
The data highlights the size of the demographic challenge each Asian market faces, but there are opportunities as well as risks. Crucially, there is no single magic bullet that governments can fire. The sheer diversity within Asia means each market must meet its demographic issues with a highly specific methodology. That said, Asian markets with less comprehensive state schemes may also have greater room for innovation and fewer legacy costs when compared with the West. Asian markets can also learn a great deal from the different routes being explored within the region, as we explain in the next section, which focuses on the responses—both from the government and from individuals—currently under way in the subregions of Hong Kong, Taiwan, Malaysia, and Indonesia.
Since the first outbreak recorded in December 2019, COVID-19 has caused tremendous life loss and cast major threats to the medical and healthcare systems in every affected region. While the threat of COVID-19 remains prevalent across many markets, including Asia, some clear and common demographic headwinds strengthened and, in some cases counterintuitively, amplified but not alleviated three trends—higher mortality rates among the older age cohort, fertility concerns, and decreased retirement readiness and potentially longer working years—making these existing challenges more difficult.
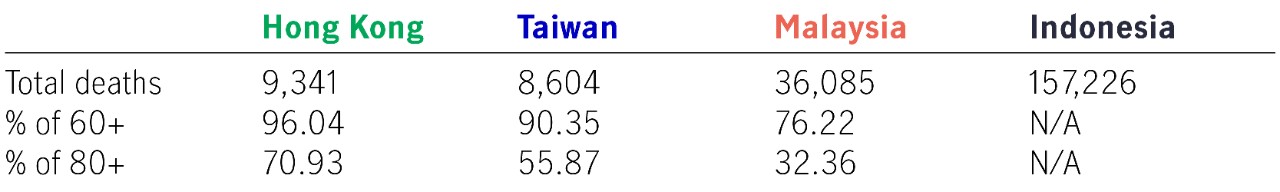
COVID-19 has increased the mortality rate, especially among older age groups that are more susceptible to severe complications resulting from COVID-19 variants. For example, in Hong Kong, more than 9,000 people died during the first five waves of the virus, the majority of these the vulnerable elderly. According to WHO estimates, by December 2021, Indonesia recorded COVID-19 related excess deaths of more than 1 million.
 Source: Malaysia: Ministry of Health Malaysia; Hong Kong: Centre for Health Protection; Taiwan: National Health Command Centre; Indonesia: World Health Organization. All data accessed as of 15 August 2022.
 Source: Malaysia: Ministry of Health Malaysia; Hong Kong: Centre for Health Protection; Taiwan: National Health Command Centre; Indonesia: World Health Organization. All data accessed as of 15 August 2022.
COVID-19 has potentially had a damaging effect on fertility rates. While the longer-term trends aren’t yet clear, a more protracted decline in fertility rates would exacerbate the already imbalanced population age structures in those markets with aged or ageing societies, such as Hong Kong and Taiwan. In Indonesia, government officials have been worrying that COVID-19 would post severe limits on people’s access to contraceptives, which could lead to a surge in pregnancies and births, but the fertility rate in 2021 remained at a low level.
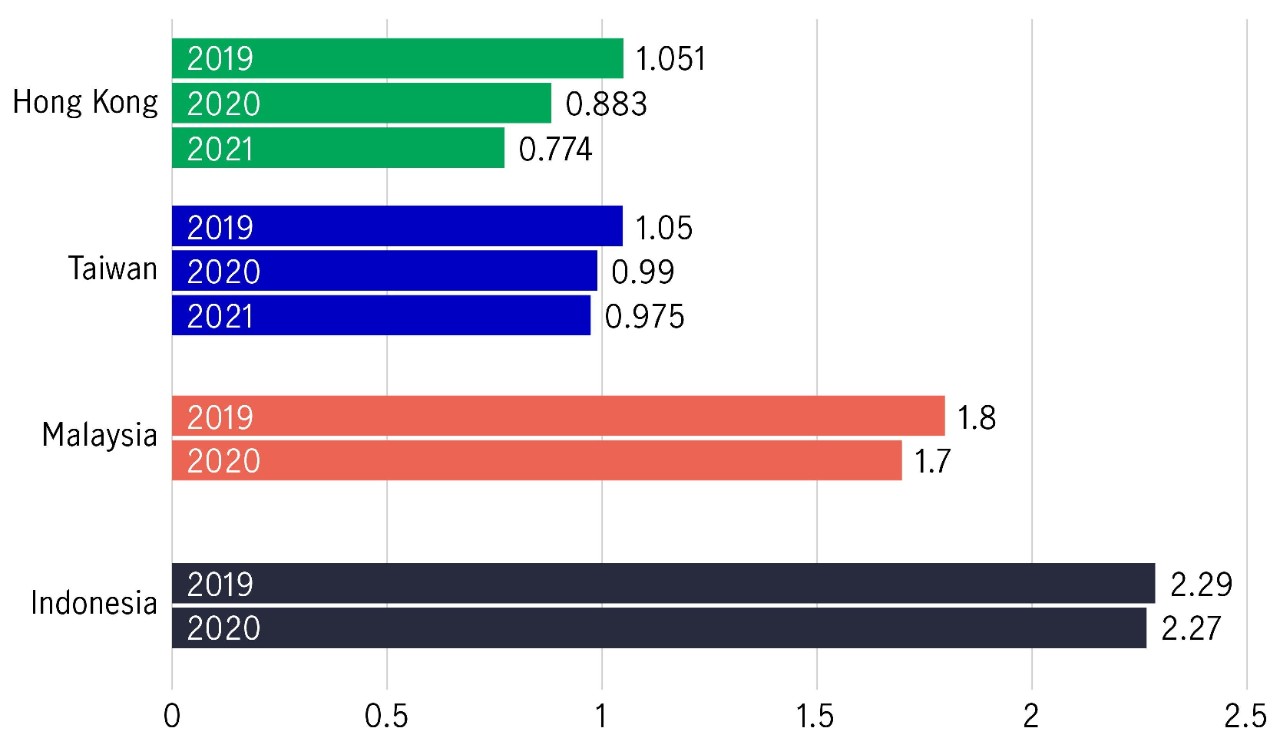

Total fertility rate per woman
Sources: Hong Kong: “Total fertility rate” by Census and Statistic Department, HKSAR, 2022; Taiwan: Department of Household Registration Affairs, Taiwan, 2022; Malaysia: Department of Statistics, Malaysia, 2022, data as of 2020; Indonesia: “Fertility rate, total (births per woman) - Indonesia” by World Bank Open Data, data as of 2020. Data are rounded to two decimal places.
COVID-19 has weakened people’s finances and forced them to dip into their long-term savings, potentially eroding their retirement income. Some markets also chose to relax pension contribution requirements, which is likely to mean more citizens pushing back their retirement in order to rebuild their retirement savings.
For example, in Malaysia, under severe pressure during the pandemic, the market’s government reduced employee contributions and allowed employees facing economic hardship to make withdrawals from their national defined contribution system, known as the Employees Provident Fund (EPF). Since the hardship withdrawal programme was introduced, more than 7.3 million members of the EPF had taken advantage of the facility, applying to take out more than RM101 billion in retirement savings.
The Malaysian Ministry of Finance has warned of the long-term erosion effect of such special withdrawals and suggested that members will need to work for an additional four to six years to rebuild their retirement savings. It’s also worth noting that Malaysia has a relatively early retirement age (55 years) compared with other Asia markets, which has contributed to Malaysia’s ongoing pension savings gap problem, already serious pre COVID-19.
As more people across Asia leave the workforce and enter their retirement years, the financial burden on governments is increasing. Many markets are trying to establish a workable government/state-funded support or welfare regime that alleviates some of that burden from the state by applying a blended approach that encompasses the role of state, market, and family in welfare provision and a social welfare system that covers multiple domains, including social pension, healthcare (primary and acute care), and public housing.
In Hong Kong, for example, the social welfare system features a mixed model and holds a market-oriented view that welfare services are there to assist people and families in need, while many domains in welfare and Social Security are heavily subsidised by the government. While the welfare systems of developing markets are still very much under development compared with Western equivalents, efforts are being made toward a more comprehensive approach to welfare, including universal healthcare.
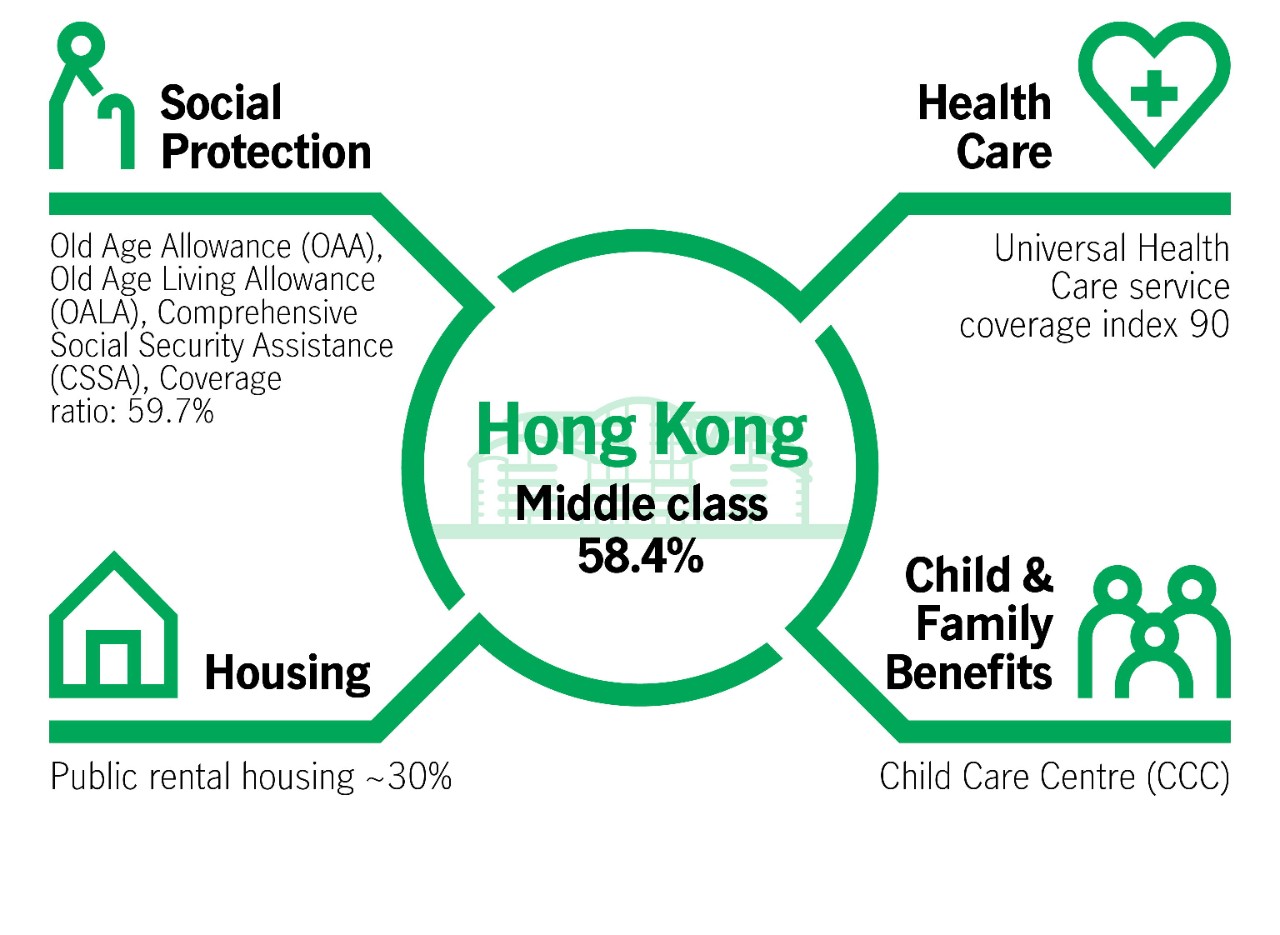
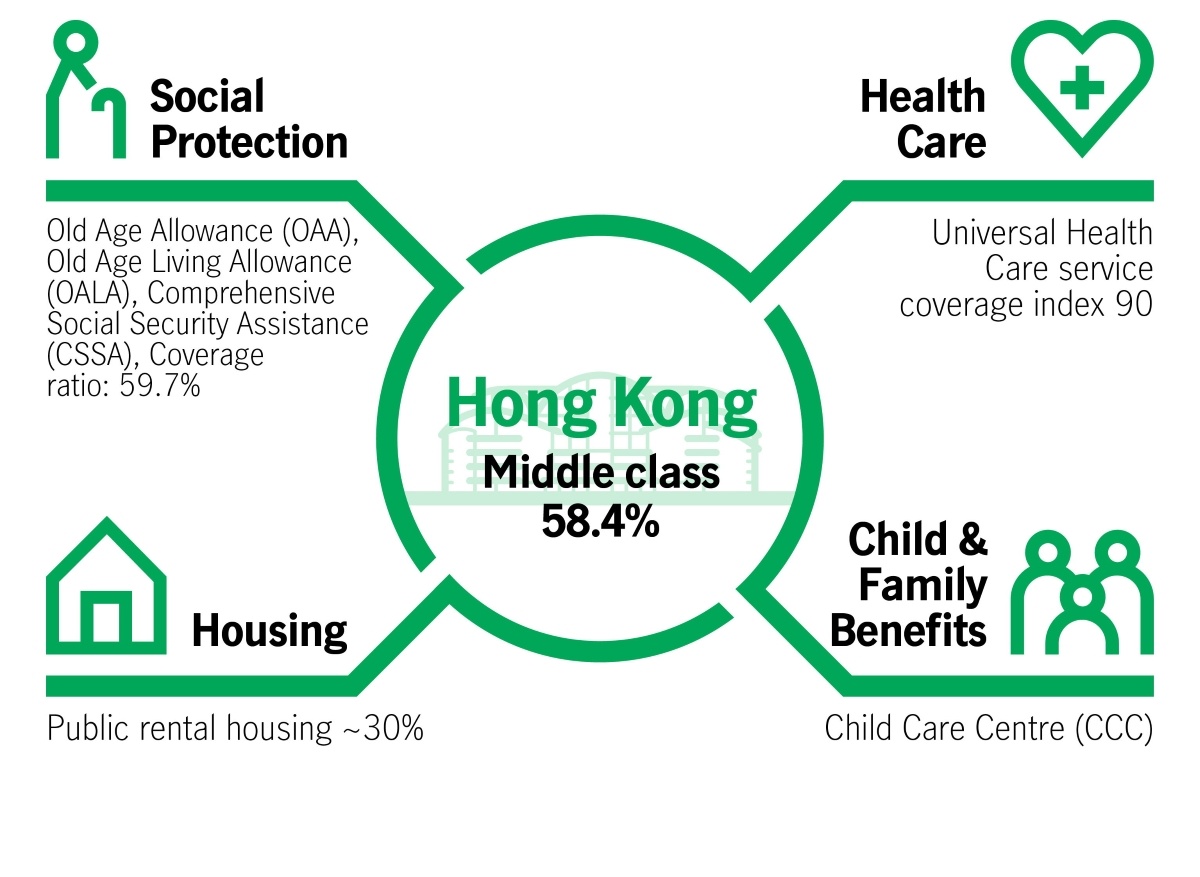
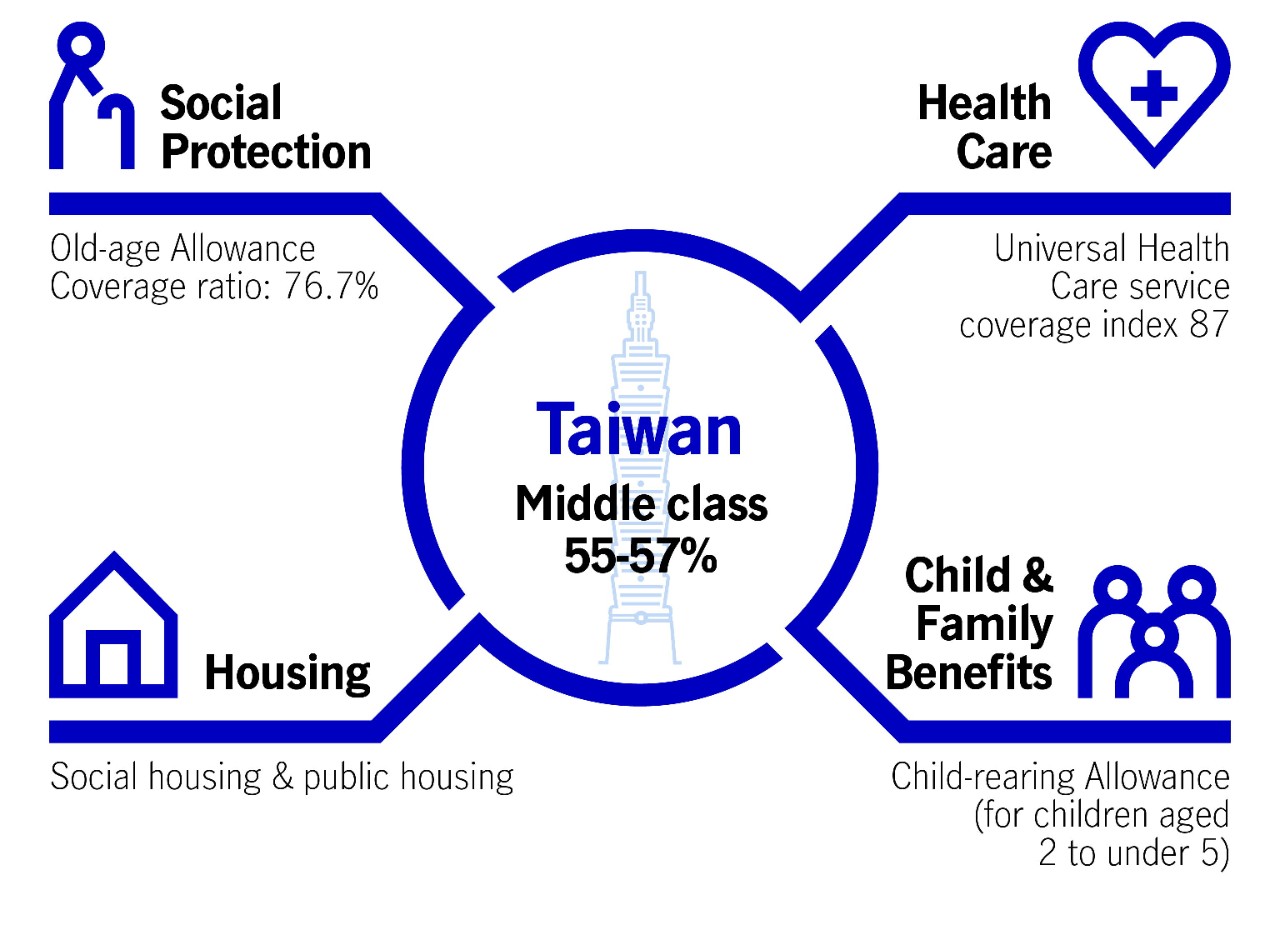

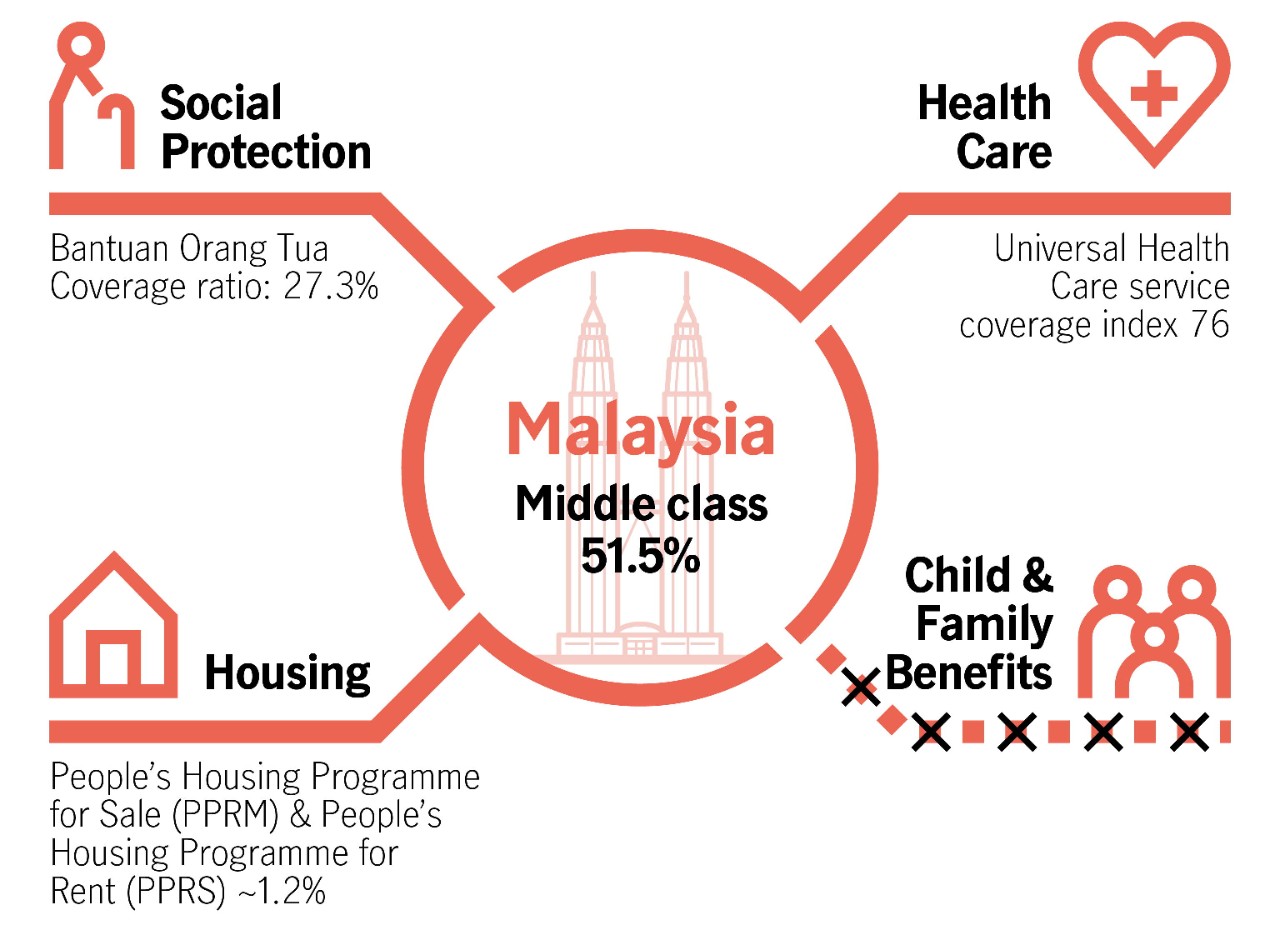
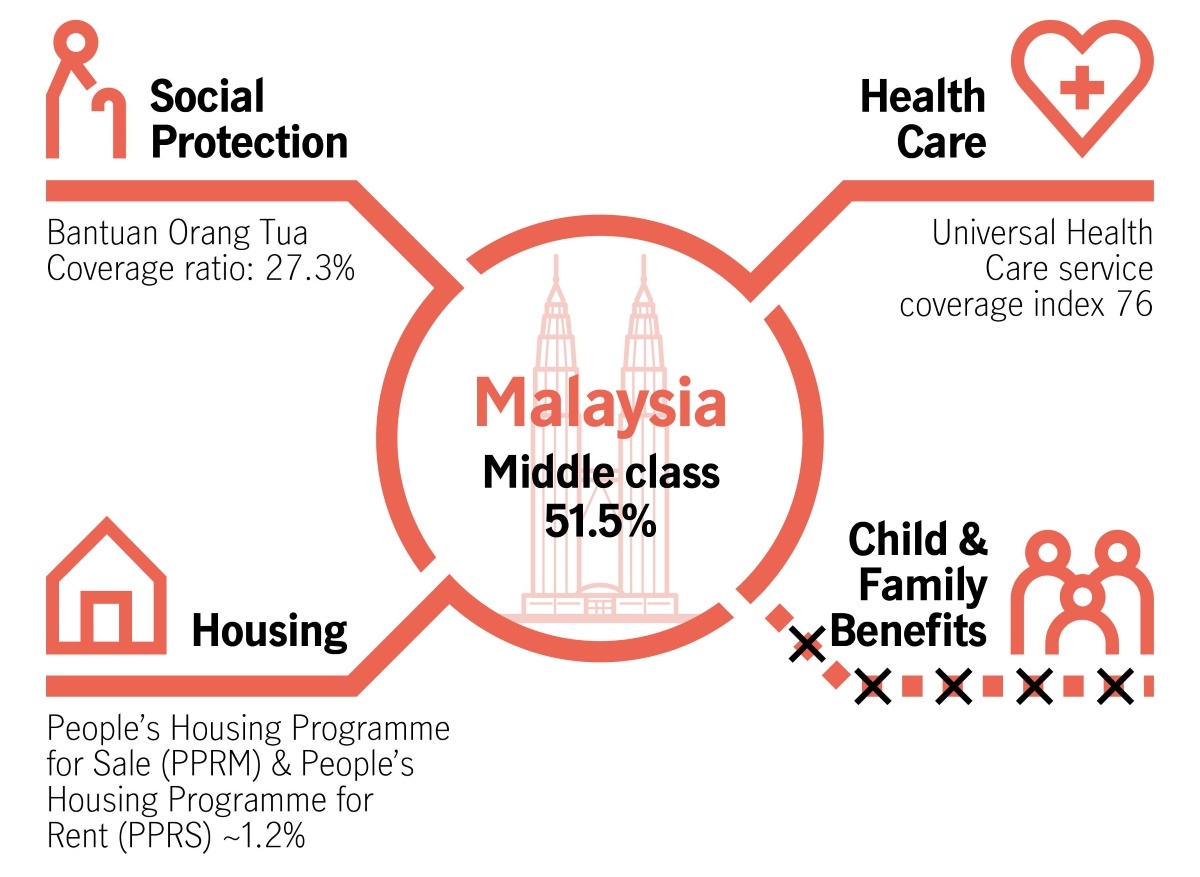
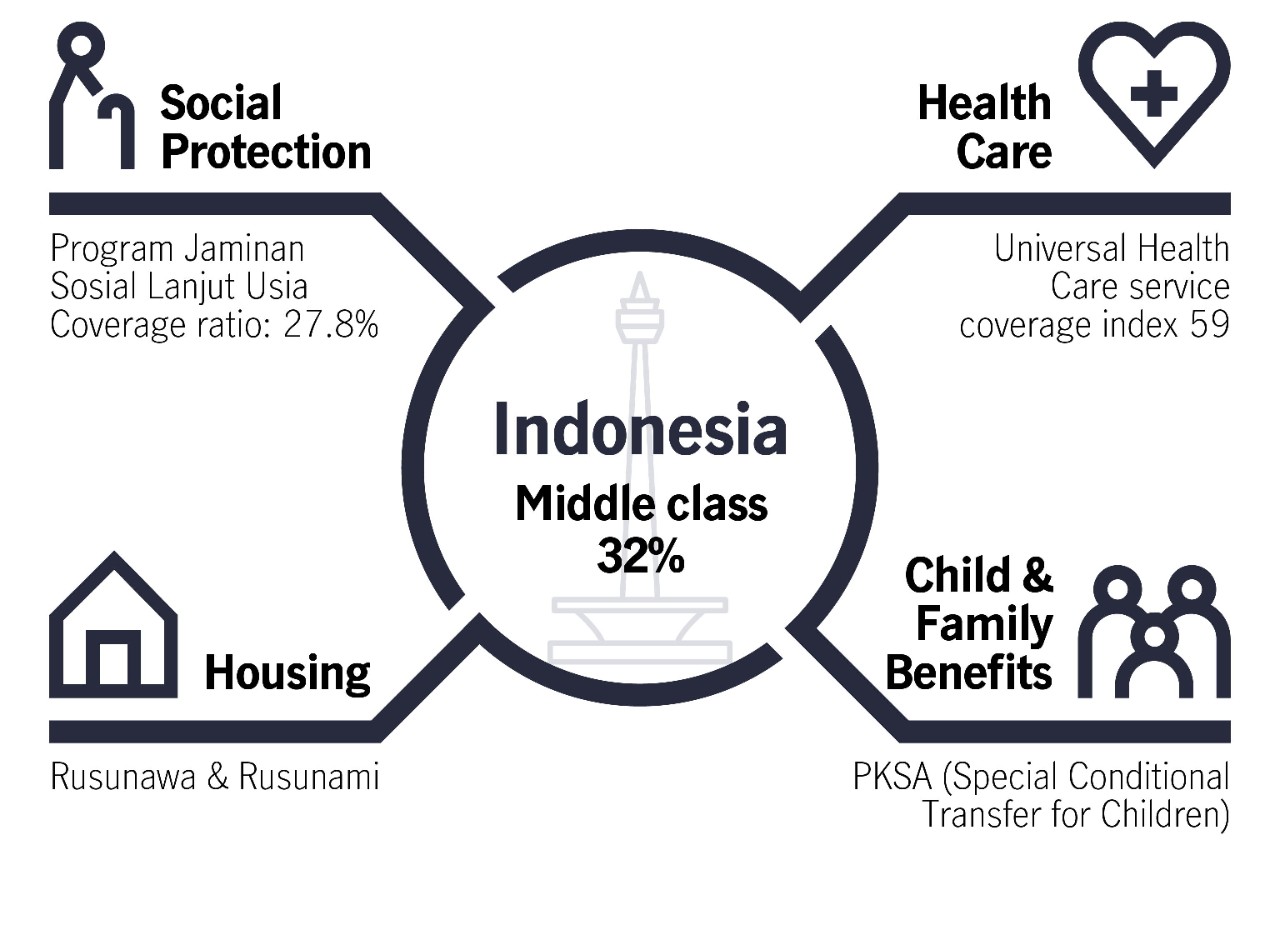
Source: Legco, 2018; MPFSA, 2022. Social pension, child and family support data compiled from “Statistics on social protection” by ILOSTAT, 2022 (https://ilo/org/topics/social-protection/) ; Health care data for regions other than Taiwan are compiled form “Universal Health Care Service Coverage Index”, WHO, 2022; Health care data for Taiwan is adapted from “Universal Health Coverage: Taiwan International Nursing Conference 2020” by Ministry of Health and Welfare, 2020; Housing data for Hong Kong is adapted from “Population by Census 2016” by Census and Statistic Department, 2016; Housing data for Taiwan is adapted from “Public Housing Policy in Taiwan” by Chang & Yuan, 2013, The Future of Public Housing: Ongoing Trends in the East and the West, p.86; Housing data for Malaysia is adapted from “KPKT statistics 2020” by Ministry of Housing and Local Government, 2020; Housing data for Indonesia is adapted from ”Indonesia-A Roadmap for Housing Policy Reform” by Kementerian PPN/Bappenas, 2015, p.116.
Our analysis suggests that the governments of Hong Kong and Taiwan are playing a relatively significant role in terms of healthcare, employment, and housing, with a relatively dominant middle-class population (the middle class here is represented by middle income group in each market, adopting a relative approach to set the threshold); meanwhile, the role played by the Indonesian and Malaysian governments is comparatively weak. Nevertheless, Malaysia and Indonesia still rely heavily on the support of family and community as a means of overcoming the risks of an impoverished old age. From the perspective of shared roles among the government, the industries, and the family, it might could be recommended that the market focus could be better placed on fine-tuning wealth management legacy in Hong Kong and Taiwan, and more emphasis could be placed on protecting retirement incomes in Indonesia and Malaysia.
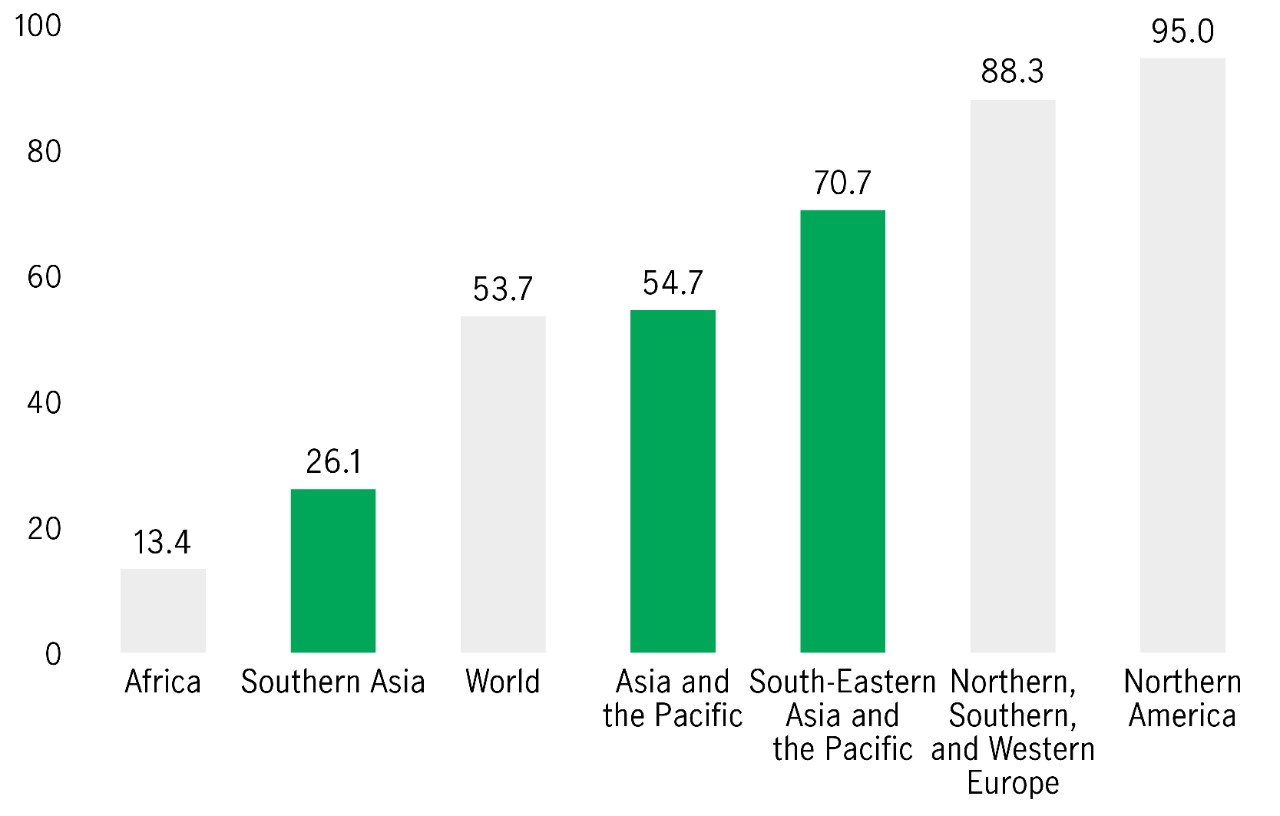
Of course, when it comes to funding a population in retirement, there’s only so much the state can afford. Investing in a pension is still the best way for individuals to maximise their chances of enjoying a comfortable retirement. Generally, the effective coverage ratio of labour force covered by active contributors to pension schemes remains significantly lower in Asia and the Pacific (54.7%) than North America (95.0%) and Europe (84.3%). We would further highlight the diverse coverage situation in Asia as recent figures suggest better coverage in South-Eastern Asia and the Pacific (70.7%) compared with Southern Asia (26.1%).
 Source: Data compiled from ILO, World Social Protection Database (2022). based on the SSI; ILOSTAT; national sources. Green represents Asia regions.
 Source: Data compiled from ILO, World Social Protection Database (2022). based on the SSI; ILOSTAT; national sources. Green represents Asia regions.
One important indicator of the relative health of different markets’ pension systems is the replacement rate, which measures how effectively pensions pay out a similar level of income compared with their earnings before retirement. According to the OECD, net pension replacement rates (defined as the individual net pension entitlement divided by net preretirement earnings, taking account of personal income taxes and Social Security contributions paid) show great diversity across Asia-Pacific markets (ranging from 39.3% in Thailand and 41.4% in Hong Kong to 85.5% in Malaysia and 99.3% in India), while the OECD market average is around 63%. In other words, across some Asian markets, people could receive a pension that would still be insufficient to allow them to live comfortably in retirement.
All these indicators lead us to believe that many of Asia’s retirement income systems are unprepared for the rapid population ageing that’s expected to occur over the next two decades. Therefore, across Asia, government policies need to undertake pension reform and through government’s introduction of greater incentives to save more (both on a mandatory and voluntary basis) for retirement. For their part, financial institutions can help meet the rising demand for retirement income products that deliver on the return expectations of pension savers. On an individual level, if people wish to achieve a comparable living standard during retirement, they must make their own preparations while also considering the need for continued family support.
Arguably, the COVID-19 pandemic has helped to accelerate some digital healthcare services that will benefit those ageing populations. In Indonesia, for example, the Ministry of Health partnered with the ride-hailing firm Gojek and telemedicine provider Halodoc to deliver faster diagnostics of COVID-19 in rural areas. Indonesia’s government also successfully launched PeduliLindungi, a COVID-19 tracing app that warns users in real time when they come into contact with a patient with a suspected COVID-19 infection. In Malaysia, the Ministry of Health partnered with telemedicine platform DoctorOnCall to establish a virtual health advisory portal to deliver free consultations with family medicine specialists. Indeed, both Indonesia and Malaysia are quite advanced within Asia in regulating telemedicine, and they have provisions in place on telemedicine-related data privacy.
A shrinking working age population can be observed in some Asian middle-income markets, but this is by no means a universal trend; in Indonesia, for example, the working age population increased from 53.4% in 1971 to 70.7% in 2020. This gives Indonesia and other young Asian nations a demographic dividend, which gives them the opportunity to develop their respective economies and invest in the health and the quality of life of its citizens.
In Hong Kong, which leads the world in terms of life expectancy, the government has committed significantly greater resources into developing a long-term care system and the promotion of greater health services to cope with mounting needs. According to its Labour and Welfare Bureau: “The total expenditure on elderly services in 2021-22 is estimated to reach $14.2 billion, which is around 89 per cent higher than the actual expenditure in 2017-18. The increase in resources allows the Government to provide more subsidised elderly services, hence reducing the waiting time for services by elderly persons in need.”
Taiwan crossed the threshold for an ageing society in 2018, undergoing similar trends to Hong Kong in terms of healthy life expectancy, with its elderly experiencing more years lived with impairment or disabilities. In 2016, Taiwan launched its Long-Term Care (LTC) Plan 2.0, a more comprehensive system designed to support the implementation of more services for the elderly. The plan includes expanded coverage and easy-to-find services, a three-tier community-based system to promote ageing in place, and a new subsidy schedule with customised care plans. The Taiwan government also lowered the minimum age for care recipients (from people aged 65 years) to 50 in the LTC Plan 2.0.
Evidence suggests that living longer doesn’t necessarily mean living healthier; for example, in Hong Kong, people are becoming far more aware of the dangers of not saving enough to enjoy a comfortable retirement. A Hong Kong study on money management of those in mature adulthood (defined as individuals aged 50–69 in this study) showed that more than half of the people in this age group (59%) expressed their awareness on the upcoming challenges in their later life stage and were concerned they could outlive their retirement savings.
On a more optimistic note, people are also becoming more financially astute and keen to do more to change their financial situation where possible. A majority of the survey’s participants (85%) agreed that they would benefit from access to increased resources aimed at educating them on how to achieve a healthier retirement. Increased awareness therefore brings with it the possibility of change—and hope. However, the same report also suggested there’s no one-size-fits-all approach when it comes to financial education or solutions for those who are either preparing for retirement, approaching retirement, or are already retired. Different strategies must be tailored to fit the needs of these subgroups.

Asia’s retirement landscape remains very different from Europe and the United States. Pressures certainly exist, but people are becoming increasingly financially aware and are keen to learn, adapt, and prepare themselves. Governments also recognise the issues facing them and are exploring different ways to meet the challenge. Some economies, such as Brunei, have raised the retirement age, Indonesia has increased Social Security contributions, and Thailand and Vietnam have both enhanced non-contributory pensions. While clearly more can—and must—be done in terms of policy initiatives, we expect these will follow.
As noted, the pandemic and its aftermath should spur governments within Asia to continue to improve their respective healthcare provisions, and we’re already seeing some exciting healthcare innovations and new treatments. If the goal of society is to improve the quality of life for all of its citizens, then the current outlook deserves to be viewed with a sense of optimism.
From a financial perspective, an ageing population will continue to present unique opportunities within certain industries; in particular, the rise in the retiring population should drive the demand for wealth management services. Greater financial education for this cohort of the population should only accelerate that demand, helping to create a populate that feels financially empowered and in charge of their own financial future. But people can’t solve this problem alone: Government policy has an increasingly important role to play. Affordable and accessible healthcare is one important aspect; another involves pension reform and introducing meaningful incentives to save for retirement. In this respect, markets within Asia can learn a great deal from one another. Asia’s diversity is one of its greatest strengths, and through this diversity lies the path to overcoming its demographic challenges.
In our next article, we’ll take a deeper look at the retirement readiness of Asia, highlight the factors behind the gender pension differences, and explore how this income gap can be bridged.
We would like to express our thanks to Dr. C.H.Peng, Department of Social Work and Social Administration, the University of Hong Kong, who contributed feedback to the manuscript.
1 Manulife Investment Management engages the Sau Po Centre on Ageing at the University of Hong Kong (“HKU”) in the capacity of consultant (consultancy fee incurred) to perform the consultancy services for the Diverse Asia thought leadership series.
2 Hong Kong: Centre for Health Protection of the Department of Health, data captured since the outbreak of the fifth wave (provisional data), as of 15 August 2022; Taiwan: Taiwan Centers for Disease Control, as of 15 August 2022. Malaysia: The official Malaysia government website for data and insights on COVID-19, cumulative death since the outbreak of COVID-19 from 2020 (number of death cases in the past 24 weeks, age group 60+), as of 15 August 2022; Indonesia: World Health Organization, cumulative death since the outbreak of COVID-19 from 2020as of 15 August 2022.
AHWIN (2020) Data on Aging. Available from ahwin.org/data-on-aging; compiled based on United Nations, Department of Economic and Social Affairs, Population Division, World Population Prospects: The 2019 Revision, Key Findings and Advance Tables (2019).
Andersson, P. (2022) Leaving No One Behind in Asia and the Pacific - Experience with Statistical Tools, Social Development Division, ESCAP.
Brown, T. H., Richardson, L. J., Hargrove, T. W., & Thomas, C. S. (2016) “Using Multiple-hierarchy Stratification and Life Course Approaches to Understand Health Inequalities: The Intersecting Consequences of Race, Gender, SES, and Age”. Journal of Health and Social Behavior, 57(2), 200–222. Available from https://doi.org/10.1177/0022146516645165.
Census and Statistics Department. (2016). Housing Characteristics of Hong Kong, Population by Census 2016. HKSAR.
Chang, C.O., & Yuan, S.M. (2013). Public Housing Policy in Taiwan. In the Future of Public Housing (pp. 85–101). Springer Berlin Heidelberg. https://doi.org/10.1007/978-3-642-41622-4_6
Gender Equality Committee of the Executive Yuan. (2022). Total fertility rate [Data set]. https://www.gender.ey.gov.tw/gecdb/Stat_Statistics_Query.aspx?sn=y%24Y9258dU59GrN2vb76Uaw%40%40&statsn=hAycDNH6og5HX58VF4YjEg%40%40&d=&n=196618 [Chinese only]
Guinea-Martin, D., Mora, R. & Ruiz-Castillo, J. (2018) The Evolution of Gender Segregation over the Life Course. American Sociological Review, 83(5),983-1019.
ILO, World Social Protection Database.(2022).Retrieved from https://wspr.social-protection.org
K H Chan, R. (2002). The Welfare System in Southeast Asia: Development and Challenges. In R. K. H. CHAN, K. K. LEUNG, & R. M. H. NGAN (Eds.), Development in Southeast Asia: Review and Prospects (pp. 131-162). (Routledge Revivals). Ashgate Publishing Ltd.
Lou, V, et al. (2021). Research on retirement protection and related services in Hong Kong: Survey on retirement readiness of middle-income group. HKRSA. Available from https://repository.cihe.edu.hk/jspui/handle/cihe/1643.
Mungkasa. O. (2015). Indonesia-A Roadmap for Housing Policy Reform. Retrieve form https://www.academia.edu/12118993/Indonesia_A_Roadmap_for_Housing_Policy_Reform
Middle income group for HK: Households belong to the 3rd monthly income quintile. Reference: Wong. Y.C. et al (2021) Research on Retirement Protection and Related Services in Hong Kong. HKRSA.
Middle income group for Taiwan: Households with disposable income between 75% and 200% of the median income. Reference: 連賢明、楊子霆與曾中信 (2022) 《臺灣中產階級所得變動趨勢之研究》。國家發展委員會(台灣)。報告編號 (111)003.0202 [Chinese Only]
Middle income group for Malaysia: 2.5 x poverty line - Mean Income. Reference: World Bank (2014) “Malaysia Economic Monitor: Towards a Middle-Class Society.” Report No. 93237, World Bank, Bangkok.
Middle income group for Indonesia: Individuals with incomes between 75% and 200% of the nation median income. Reference: Kharas, H. (2010) "The Emerging Middle Class in Developing Markets", OECD Development Centre Working Papers, No. 285, OECD Publishing, Paris
Ministry of Finance Malaysia. (2022, March 3). EPF special withdrawals totalling RM101 bln benefit 7.34 mln members - MOF [Press citations]. Retrieved from https://www.mof.gov.my/portal/en/news/press-citations/epf-special-withdrawals-totalling-rm101-bln-benefit-7-34-mln-members-mof
Ministry of Housing and Local Government, (2020). KPKT statistics 2020. Indonesia. Retrieved from: https://www.kpkt.gov.my/kpkt/resources/user_1/GALERI/PDF_PENERBITAN/PERANGKAAN%20TERPILIH/STATISTIK_TAHUNAN_KPKT_2021_14112021_UKK.pdf
Mohd Jaafar, N., Awang, H., Mansor, N., Jani, R., & Abd Rahman, N. (2020) Examining Withdrawal in Employee Provident Fund and its Impact on Savings. Ageing International, 46(1), 70-82.
Murphy, J. (2019). The Historical Development of Indonesian Social Security. Asian Journal of Social Science, 2019(2), 255-279.
OECD (2018), "Net replacement rates", in Pensions at a Glance Asia/Pacific 2018, OECD Publishing, Paris, https://doi.org/10.1787/pension_asia-2018-8-en.
OECD. (2020). Health at a Glance: Asia/Pacific 2020 : Measuring Progress Towards Universal Health Coverage. Retrieved from: https://www.oecd-ilibrary.org/sites/1ad1c42a-en/index.html?itemId=/content/component/1ad1c42a-en
Powell, M., & Barrientos, A. (2004) Welfare Regimes and the Welfare Mix. European Journal of Political Research, 43. 83-105. 10.1111/j.1475-6765.2004.00146.x.
Salignac, F., Hamilton, M., Noone, J., Marjolin, A., & Muir, K. (2019) Conceptualizing Financial Wellbeing: An Ecological Life-Course Approach. Journal of Happiness Studies, 21(5), 1581-1602.
Sit, D. (2019). The ASEAN Digital Health Landscape: An Overview. HKTDC. Retrieved from: https://research.hktdc.com/en/article/ODU1NDkyNDU0
The ASEAN Post Team. (2021, February 13). Indonesia: Baby Boom or Bust? The ASEAN Post. https://theaseanpost.com/article/indonesia-baby-boom-or-bust
Yang, C.C., Hsueh, J.Y., Wei, C.Y. Current status of long-term care in Taiwan: transition of long-term care plan from 1.0 to 2.0. Int J Health Policy Manag. 2020;9(8):363–364. doi:10.15171/ijhpm.2019.115
Sumarto, M. (2020) Insecurity and Historical Legacies in Welfare Regime Change in Southeast Asia – Insights from Indonesia, Malaysia, and Thailand. Social Policy and Society: A Journal of the Social Policy Association, 19(4), 629-643.
UNESCAP. (2017). Aging in Asia and the Pacific: Overview. Retrieved from: https://www.unescap.org/sites/default/files/SDD%20Ageing%20Fact%20Sheet%20Overview.pdf
United Nations, Department of Economic and Social Affairs, Population Division (2022). World Population Prospects 2022, Online Edition.
WHO. (2017). Healthy life expectancy (HALE) Data by Market [Data set]. Retrieved from: GHO | By category | Healthy life expectancy (HALE) - Data by market (who.int)
World Bank, Fertility rate, total (births per woman) - Indonesia. (2020). Retrieved from https://data.worldbank.org/indicator/SP.DYN.TFRT.IN?locations=ID
Wu, Y., Lo, W., Lu, T., Chang, S., Lin, H., & Chan, C. (2021). Mortality, morbidity, and risk factors in Taiwan, 1990–2017: Findings from the Global Burden of Disease Study 2017. Journal of the Formosan Medical Association, 120(6), 1340-1349.
Yang, C.C., Hsueh, J.Y., Wei, C.Y. Current status of long-term care in Taiwan: transition of long-term care plan from 1.0 to 2.0. Int J Health Policy Manag. 2020;9(8):363–364. doi:10.15171/ijhpm.2019.115
Zheng, Y., Cheung, K. S. L., & Yip, P. S. F. (2020). Are We Living Longer and Healthier? Journal of Aging and Health, 32(10), 1645–1658. https://doi.org/10.1177/0898264320950067
©1999 - 2025 Manulife Investment Management (M) Berhad (Registration No. 200801033087 (834424-U))